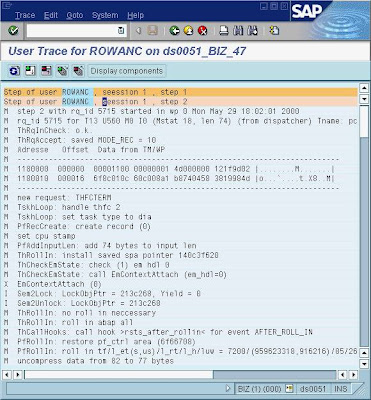
The user trace is used to look for errors that occur with certain users and not with others. Trace information, located in the developer trace for each work process, is written to the user trace from the user view, if this option is activated.
Activate the user trace only as long as you need it to reproduce error situations, and then deactivate it. This prevents system performance from being affected, and unnecessarily large trace files from being produced.
Prerequisites
You are in the user overview (screen User List) and have selected the user(s) who you want to trace.
Features
You can do the following with the user trace:
· Activate (User ® Trace ® Activate for trace level 2 or User ® Trace ® Activate (Detail) for trace level 3)
· Deactivate (User ® Trace ® Deactivate)
· Display (User ® Trace ® Display Trace, detail selection in the following dialog box, see below)
· Reset (User ® Trace ® Reset). You can reset all trace files dev*, or the work process trace files (dev_w*) only.
If you select the function Display, a dialog box appears where you can enter information to filter the trace display. You can also set the loading components (SAP Kernel components that should write trace information) and the display components (the parts of the loading components whose trace information is also displayed).
Trace Display
In the trace display (screen User Trace for
You can:
· Expand and collapse the individual steps (double-click on the step or the left green or red ‘+’/ ‘-’ button on the menu bar)
· Expand or collapse all the steps at once (right ‘+’ or ‘-’ button on the menu bar)
· Output the trace information without a format (Trace ® Unformatted or Shift + F2)
· Set the load and display components (Trace ® Component selection)
· Reset the trace file (delete) (Edit ® Reset trace)
· Run a function trace (Edit ® Function Trace)
· Go to the next C-stack (Edit ® Next C stack)
· Go to other system functions (Goto)


Comments (0)
Post a Comment